Create interactive charts with AI Graph Maker. Turn your data to custom bar charts, line charts, flowcharts, pie charts and scatter plots with AI effortlessly.
Okay, I’ve dug through everything, from their official site to what folks are saying out there on the web. It’s time to put it all together. Here’s the definitive guide to AI Graph Maker!
AI Graph Maker Review: Unlocking Instant Data Visualization with AI
You’re here because you’re probably tired of wrestling with data, trying to turn numbers into clear, compelling visuals. Trust me, I’ve been there! That’s why I took a deep dive into AI Graph Maker (aigraphmaker.net), a tool promising to revolutionize how we create charts and graphs. After a thorough exploration, here’s my take:
Key Information
- What it is: AI Graph Maker is an AI-powered online tool that allows users to instantly generate a wide variety of interactive charts and diagrams from raw data, without requiring any coding or design expertise.
- Best For: Anyone needing to quickly visualize data or complex relationships, including business professionals, marketers, project managers, students, and researchers looking to create professional-grade graphs effortlessly.
- My Key Finding: Its most powerful feature, based on my research, is its remarkable chart diversity combined with AI-driven automation, which makes creating specialized graphs like Sankey diagrams, Gantt charts, and Knowledge Graphs incredibly accessible.
What is AI Graph Maker?
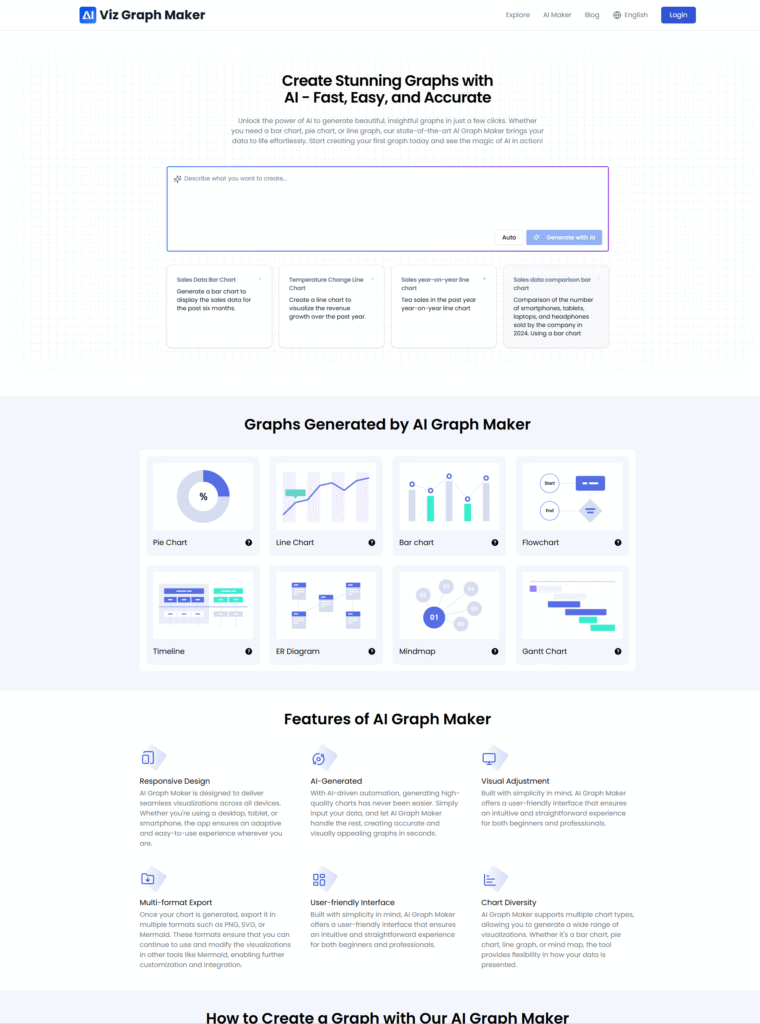
AI Graph Maker is an intuitive online platform designed to simplify the often-complex process of data visualization. Its primary function is to transform your raw data, whether manually entered or imported, into stunning and insightful graphs and diagrams with the help of artificial intelligence.
The core problem it solves is the time-consuming and often skill-intensive nature of traditional graph creation. It removes the need for coding knowledge or advanced design skills, making professional-looking data visualization accessible to everyone. The tool promises to bring your data to life effortlessly, whether it’s a simple bar chart or a complex mind map.
Features of AI Graph Maker
After exploring their website, here are the standout features that make AI Graph Maker a powerful tool for data visualization:
- AI-Generated: This is the heart of the tool. Simply input your data, and the AI automatically analyzes it to generate accurate and visually appealing charts in seconds.
- Chart Diversity: AI Graph Maker supports an impressive array of chart types, far beyond just basic bar and pie charts. I found options for line graphs, mind maps, flowcharts, Gantt charts, radar charts, funnel charts, Treemaps, Sunburst charts, Sankey diagrams, C4 Diagrams, ER Diagrams, Organization Charts, and even Knowledge Graphs. This extensive library is a significant advantage for specific use cases.
- Visual Adjustment/User-Friendly Interface: The platform boasts a simple and intuitive interface that allows for extensive customization. I could easily tailor colors, labels, fonts, titles, and other elements of my AI-generated graphs to match specific preferences.
- Responsive Design: AI Graph Maker ensures that visualizations look seamless and are easy to interact with across all devices, whether you’re using a desktop, tablet, or smartphone.
- Multi-format Export: Once your graph is perfect, you can export it in various useful formats, including PNG (for images), SVG (for scalable vector graphics), and even Mermaid (for further customization in other tools).
Use Cases of AI Graph Maker
AI Graph Maker is designed for anyone who needs to present information clearly and compellingly. The target audience spans various roles and industries due to its versatility and ease of use.
Here are some specific examples of what you can do with the tool:
Related Posts
- Project Management: Quickly generate Gantt charts to plan tasks, track progress, and optimize resource allocation, ensuring projects stay on schedule. You can also create timelines and flowcharts to clarify task dependencies and workflows.
- Business & Financial Analysis: Visualize market trends with line charts, compare product performance using bar charts, or illustrate financial allocations with pie and stacked bar charts. It’s ideal for creating professional reports and infographics without design skills.
- Educational & Research Purposes: Students and researchers can rapidly chart survey results, experimental data, or complex academic relationships using scatter plots, treemaps, or knowledge graphs for papers and presentations.
- Marketing & Sales: Analyze conversion rates with funnel charts, map user journeys, or track campaign performance over time using line and bar graphs.
- Brainstorming & Planning: Use the mind map feature to visualize relationships between a central theme and subtopics, making it useful for creative work, decision-making, and team planning activities.
How To Use AI Graph Maker?
Getting started with AI Graph Maker is surprisingly straightforward. To give you a clear picture, I went through the steps myself:
- Input Your Data: To get started, I navigated to their homepage (aigraphmaker.net). The first step is to input your data. You can either type it in manually or upload a data file (like a CSV or Excel file). The AI is designed to analyze your data automatically.
- Choose Your Graph Type: Next, I selected the type of graph I wanted to create. The website offers a diverse range of options, from classic bar and line charts to more specialized ones like flowcharts or Gantt charts.
- Generate Your Graph: With the data in and the graph type selected, I clicked the “Create Graph Now” button. The AI then instantly worked its magic, transforming the raw data into a visual.
- Customize Your Graph: Once the initial graph appeared, I could easily tailor its appearance. This involved adjusting colors, labels, fonts, and other elements to ensure the graph matched my desired aesthetic and clarity.
- Download and Share: Finally, after customizing, I could download the finished graph in my preferred format (PNG, SVG, or Mermaid) or share it directly.
FAQ
Based on discussions I’ve seen and common questions about AI visualization tools, here are some FAQs:
- Q: Can I customize the style and content of the generated graphs?
Absolutely! AI Graph Maker allows full customization. After generation, you have the flexibility to adjust data content, change colors, fonts, labels, and titles, and the graph updates in real-time to reflect your choices. - Q: What file formats can I use to import my data?
The tool supports various data file formats, including TXT and Excel. You can also manually enter your data directly into the interface. - Q: Is AI Graph Maker free to use?
Most AI graph generators, including AI Graph Maker, typically operate on a “freemium” model, offering a free tier with basic features and limited usage, with paid plans available for more advanced features or unlimited use. - Q: What if I encounter an issue or need technical support?
If you run into any problems, you can contact their technical support team directly via email at [email protected]. They aim to assist with any issues related to graph creation or platform features.
Conclusion
So, what’s the bottom line? AI Graph Maker (aigraphmaker.net) stands out as an incredibly efficient and user-friendly tool for anyone looking to create professional and insightful data visualizations without the steep learning curve of traditional software. Its vast array of chart types, coupled with seamless AI generation and extensive customization options, makes it a valuable asset for quick analysis, compelling presentations, and clear communication across various fields. If you’re a student, a project manager, a marketer, or just someone who needs to make sense of data visually, this tool is definitely worth exploring.
Have you tried AI Graph Maker? Share your experience in the comments!